S I E M
What is collected, and how do I access it?
When using the Perch platform, one of the most common questions is, “what does Perch collect?” This page will describe to you what it is the Perch platform stores, how to access this data, as well as how long this data is available.
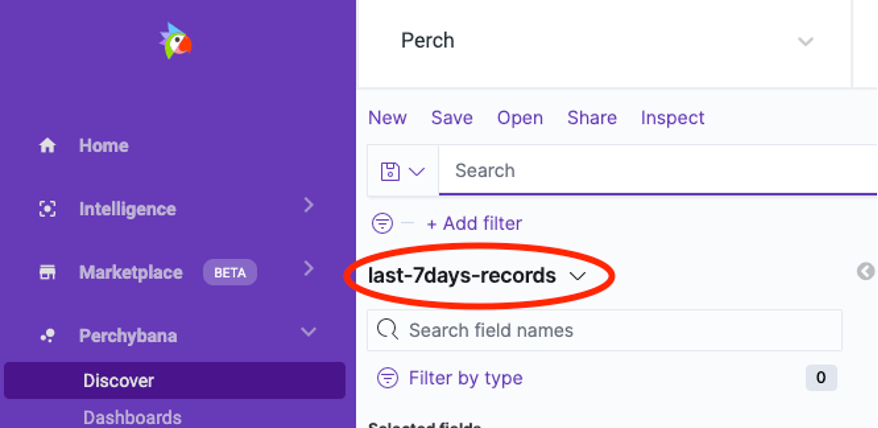
To start, let’s talk about how Perch stores the data for access. When data is sent to Perch, whether it comes from the IDS, a log shipper on a host, or one of the many integrations that Perch offers, it’ll be stored in one of our indices. You may notice that when you open up Perchybana, there’s a dropdown list that defaults to “last-7days-records”.

This index contains all records, but only includes data for the last 7 days. The different logs can be sorted by referring to their event_type. After 7 days, these records will live in their own respective index. They are only located together for quick analysis in the first week. So, if you try to search for records in this index beyond the seven-day mark using the last-7days-records index, you won’t see records.
This is where it’s important to know where your data lives, and which indexes you can reference. For instance, if we want to view an alert record, we can access this data by using the following indexes: *-alert-records, or last-7days-records.
*-alert-records will contain only the event_type of alert which can be found using the search event_type:alert. However, you can also access event_type:alert from last-7days-records.
For records that are coming in from the Perch IDS, you can reference the following: Alert, sip, ikev2, ftp_data, flow, dns, smb, tls, snmp, fileinfo, http, krb5, rdp, dhcp, tftp, ftp, ssh, stats, nfs, smtp, packet.
If you’ve installed the Perch log shipper, then you will be sending us Sysmon, Auditbeat, and Windows logs which include Security, System, and Application by default.
These records can be found by referencing the following indexes: ***-winlogbeat-records__ for Sysmon and Windows Logs, and ***-auditbeat-records** for Auditbeat. Both event types, **event_type:winlogbeat** and **event_type:auditbeat**, can be found in **last-7days-records** as well.
If you’re sending us data through an integration, such as Microsoft 365 (formerly Office 365), you’ll find these logs in their corresponding index. Examples of these logs:
Ciscoumbrella, office365, cwautomate, ciscomeraki, webroot, carbonblack, gsuite, duo, sophoscentral, awscloudtrail, sentinelone, dnp3, auth0, ciscoamp, bitdefender.
Every integration in Perch will generally have its own index and its own event type. For instance, Microsoft 365 data can be found using the index *-office365-records, and can also be found in last-7days-records under the event type “event_type:office365”
Lastly, if you’re sending us logs over syslog, you can find these records inside of *-log-records, as well as inside last-7days-records, under event_type:log.
How long does Perch store my data?
Perch stores data differently depending on the type of data that we receive.
All non-IDS log data, including windows logs, syslog, and logs from integrations, are stored for 30 days by default. This can be extended if you need longer retention for this data.
If you’re interested in longer retention for your logs, you can contact your sales representative, or contact customersuccess@perchsecurity.com, and we can get you in touch with your sales representative.
All data except the below records are subject to the purchased retention length. The below data types will be stored for 7 days to use in the analysis of new alerts.
sip, ikev2, ftp_data, flow, smb, tls, snmp, fileinfo, http, krb5, rdp, dhcp, tftp, ftp, ssh, stats, nfs, smtp, packet.
The only records that aren’t affected by this are alert records. Alert records are used to show us when the IDS and your Event Notifications have triggered.
How do I access logs older than 30 days?
As part of Perch’s standard SIEM services, we support the following two scenarios:
- Incident Response/Data Forensics: We will provide access to up to one week of log records in the production environment.
- Audits/Regulatory Examinations: If proof of log retention is requested, we ask that the organization (or the auditor/examiner) select up to three days of the audit period to view log records.
Access to older log records outside of the above use cases may be accommodated at an additional cost based on professional services and storage considerations.